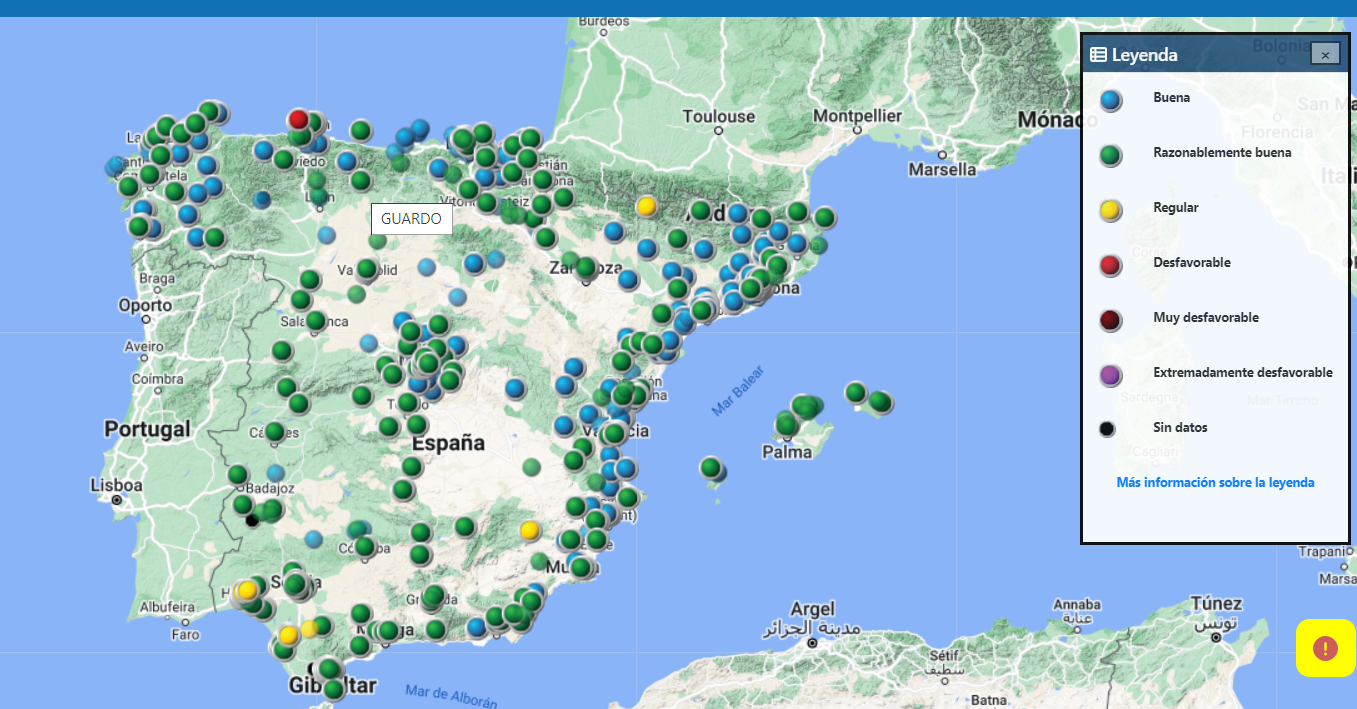
The Spanish Ministry for the Ecological Transition and Demographic Challenge publishes the National Air Quality Index (ICA), which provides real-time, easy-to-understand data on the quality of air measured by the monitoring stations from the national surveillance network. The index also provides health-based recommendations for the general population and sensitive populations and allows you to track the evolution of the status of air quality over the last months.
The ICA uses real-time data, The ICA uses real-time data, i.e., provisional and not validated data, from the air quality monitoring stations, reported every hour by the air quality networks operating in Spain. These data are supported, when necessary, by modelled data from the Atmospheric Surveillance Service (Copernicus Atmosphere Monitoring Service –CAMS) of the European Union. Note that these data do not reflect verified values and could therefore differ from data included in air quality official reports from the Ministry for the Ecological Transition and Demographic Challenge.
The ICA defines six categories of air quality. These are: good, fair, moderate, poor, very poor, and extremely poor. Each station is assigned the worst category in terms of air quality for any of the pollutants considered for estimation, whether values come from measured data or CAMS modelling data. The pollutants defined in the index are: particulate matter (PM10), particulate matter (PM2.5), tropospheric ozone (O3), nitrogen dioxide (NO2), and sulfur dioxide (SO2). (SO2).
The index design allows filtering data by the typology of the monitoring stations. Depending on the predominant emission source, stations are classified as follows: traffic stations, industrial stations, and background stations (where pollution levels are dominated by neither traffic nor industry).
The ICA is calculated for each monitoring station that has data available on at least one pollutant. Stations lacking measurements for all pollutants are shown with a semi-transparent circle. The black dots indicate stations for which no data have been reported. An asterisk next to a value indicates that the value represents modelled estimates.


